Solana’s NFT Market Shining: A Closer Look at SOL’s Declining Metrics and Market Dynamics

Solana SOL token symbol cryptocurrency in the center of spiral of glowing dots on dark background. Cryptocurrency logo icon for banner or news. Vector illustration.
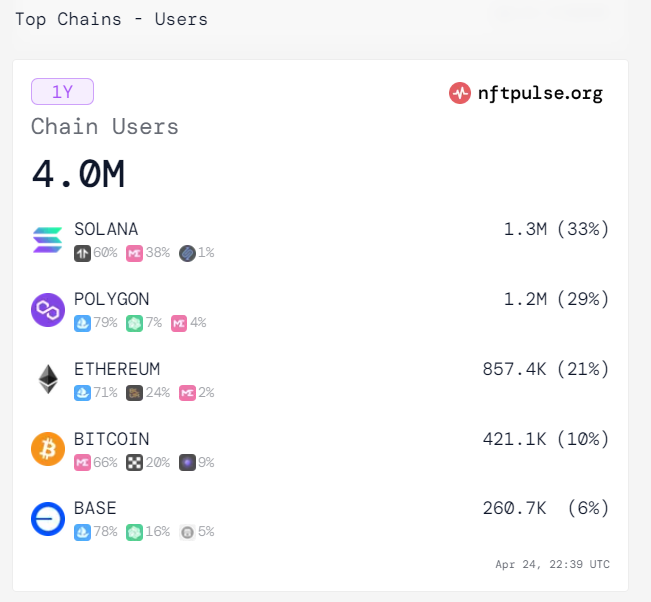
Notable players include Solana (SOL), especially in the non-fungible token (NFT) market. Comparing Solana’s NFT ecosystem to other top chains like Ethereum and Bitcoin, it has a 33% higher user adoption rate, showing that it has outperformed its rivals over the last year, according to SolanaFloor.
Popular NFT collections like MadLads, Frogana, and Sharx by sharky.fi have propelled this expansion and brought significant attention to the platform.
Recent Market Decline in Solana
For Solana, though, the last month has depicted a different picture. Cryptoslam data indicates a significant drop in NFT measures, including a 36% decrease in NFT sales volume and a decrease in the quantity of active buyers and sellers, in line with what ETHNews previously disclosed. The price fluctuation of the token reflects this decline.
According to CoinGecko, SOL is currently trading at about $136.58. This is a 4.97% decline over the last day and a similar pattern over the previous week.
On the other hand, the latest announcement by the FTX estate regarding the auction of the upcoming batch of locked Solana tokens has further complicated the dynamics of the market, as previously reported by ETHNews.
The possible effects of this revelation on market liquidity and sentiment toward Solana may help to explain some of the recent volatility.
Most importantly, Solana has not lost market share lately. It has an overall market capitalization of more than $65 billion, ranking as the fifth largest cryptocurrency in the field of paper profit.
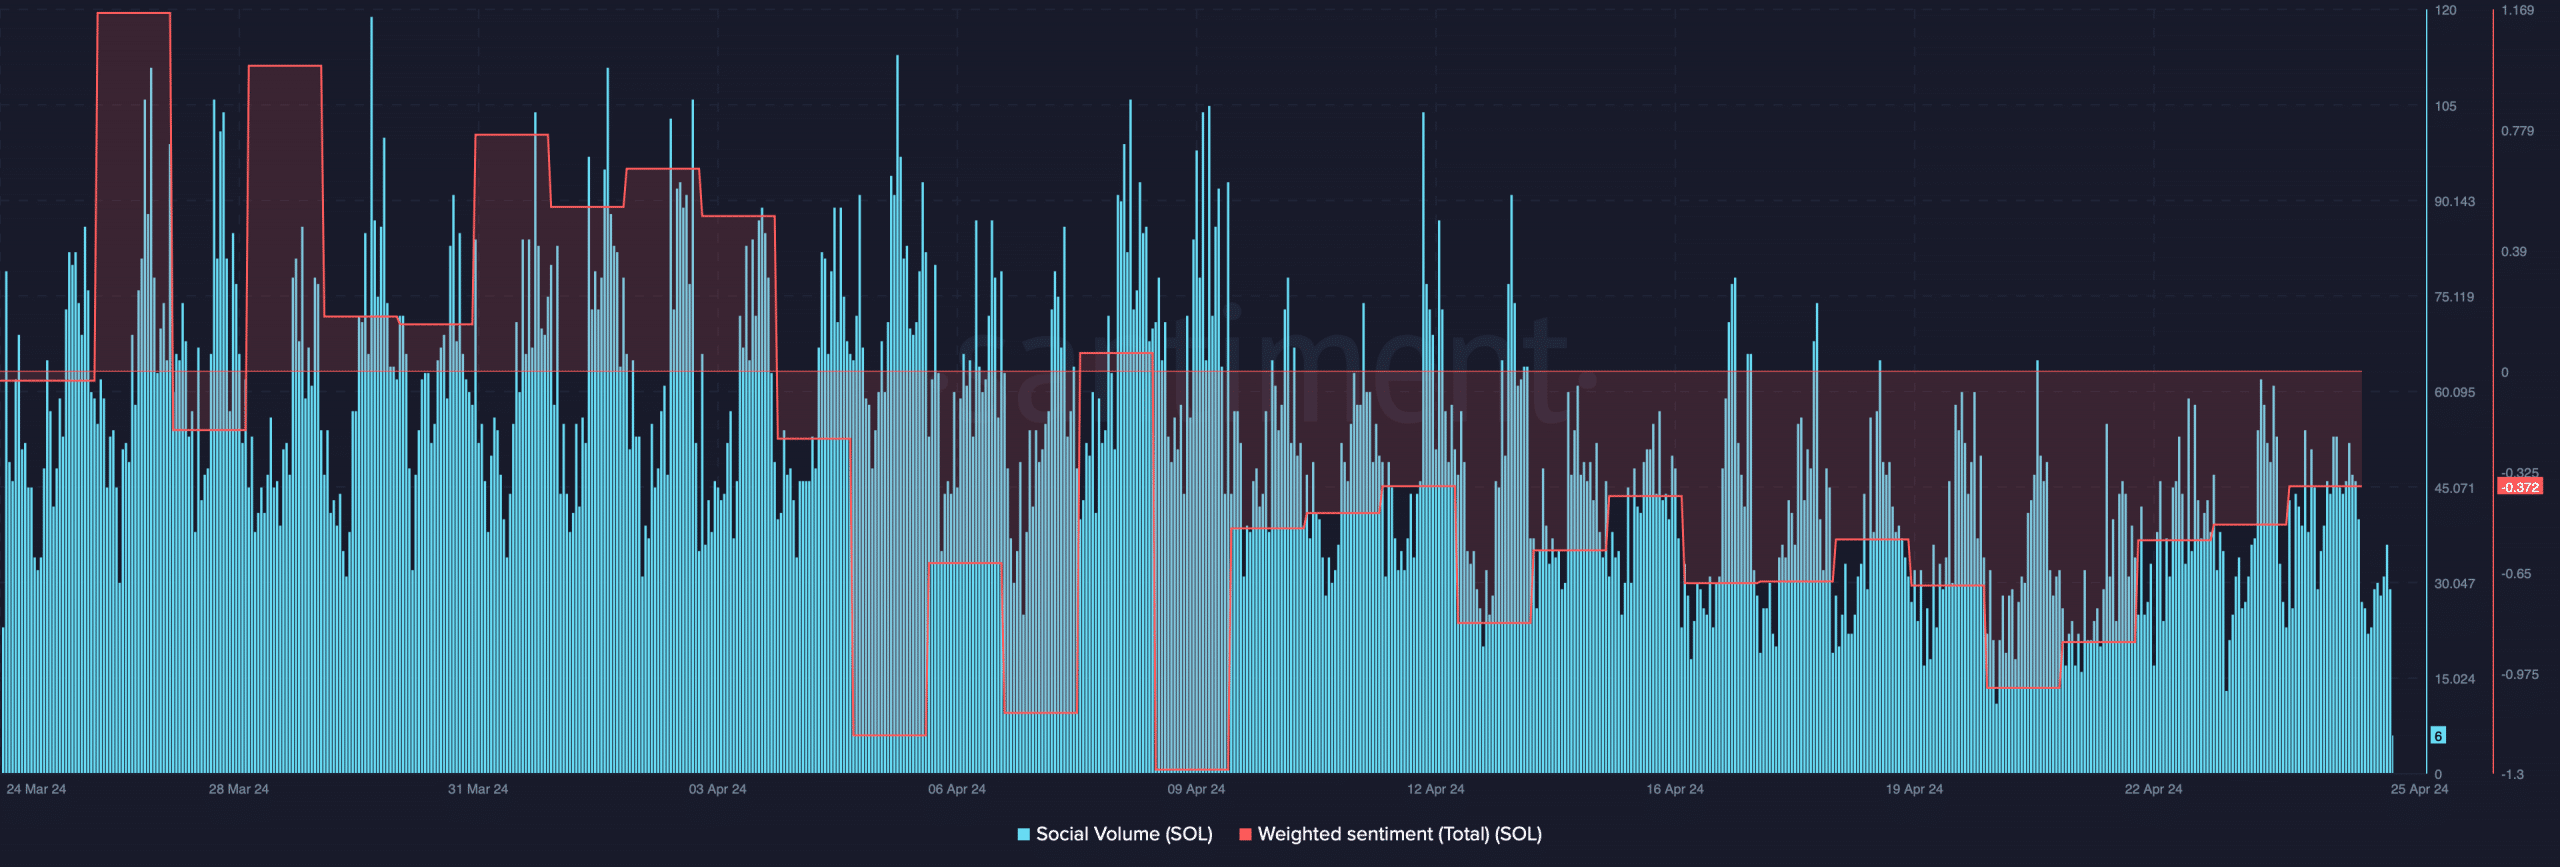
Nevertheless, Solana’s social volume is in continuous decline, and its weighted sentiment has always been unequivocally pessimistic. This is forcing a widespread decline in her popularity.
Additional insights into Solana’s market movements can be obtained using technical indicators. The Money Flow Index (MFI) and the Relative Strength Index (RSI) both show declining patterns, implying that more market falls may be ahead.

Bollinger Bands also suggest that SOL may remain bearish in the coming days or weeks due to the company’s inability to break above its 20-day Simple Moving Average (SMA) indicator.